Friday, August 10, 2012

Nat Gas Production

Natural Gas Production

The chart above shows the 30-day average production for US Natural Gas as reported by Robry. The reason why this is important is the daily production data points have significant random day-to-day movements. These movements are temporary and confuse the trend.  Clearly we still are in an upward trend. Looking at the 2nd chart below shows the clear trend lines.

As a result, the decrease in natural gas production still has not occurred.  Yes the production is off the highs, but any measure of trends, the recent declines are well within the long-term upward trend lines.   You can quibble with the exact drawing of the lines, but it is clear the natgas production has not fallen below the long-term upward trend lines.

As a result, the people who argue natgas production is headed down are not right----yet.  Clearly production is not heading up as it was late last year.  But a slowdown in an upward trend is not a decrease in production.


Monday, May 14, 2012

Greece and Gold

Right now the price of gold has not responded to the Greek Crisis. It may not for many months, but at some point the reality of the situation is going to make gold skyrocket. Why?

1) The European voters in Greece, France and even Germany have clearly told the politicians that austerity is not an acceptable course of action. In two major elections this past weekend, we saw an overhaul in management in two European countries, France and Greece.

"In France on Sunday, Francois Hollande squeaked past his opponent to win a clear majority for president. On the same day in Greece, the conservative-leaning New Democracy party and the Left Coalition party won the largest parliamentary pluralities. What is the same in both contests is that all of the victors ran on campaigns rejecting austerity measures that they claimed had crippled their respective economies, in favor of stimulus spending. Though it is only France and Greece that held elections, there appears to have emerged a widespread demand for reconsideration throughout Western Europe of the euro zone's recovery plan. And while the winning parties in Greece scramble to emerge from chaos and form some sort of ruling coalition, Hollande is secure as president, and has become the leader of this new movement, which will likely see major changes to the unity and economic integration of Europe."

German results were also a blow against austerity: "DUESSELDORF, Germany — Voters in Germany's most populous state dealt a decisive blow to Chancellor Angela Merkel's Christian Democratic Union on Sunday, preliminary results show, a potentially ominous preview of things to come for the chancellor in next year's federal elections" The voters in every country have made it very clear they do not like austerity but they want spending.

2) How are they going to pay for these programs? Every country in the EU is already spending more than they take in revenue. The only way to pay for these programs is to print more money. Quite simply there is no alternative. Either the governments cut back expenses AND raise taxes or they print more money. They WILL print more money.

3) Right now we are in a deep recession. In addition, we are in a panic (or more accurately a flight to safety). People want their investment to be safe. As a result US Treasuries are priced at the highest (lowest yield) in 50 years. People are worried and want their money to be safe. But in a highly leveraged system as the world is in today, this need for safety will cause the economy to stay very weak. Only when people are confident in the future, will business investment, jobs and the economy pick up. Instead of recognizing this and acting the current administration took the advice of pure Keynesian economists. While the government does need to act, HOW it acts IS important. Giving $500 million to Solendra to waste will not strengthen the economy, but instead will lead to further weakness. FDR was right that Fear is the problem.

One solution to get people to move out of treasuries is to scare them with inflation. The Fed is in part trying to calm markets and make long-term investments 'cheap', but something rings false. People are still sacred and not making normal investments. The hypothesis is the FED will take more and more extreme measures to force investments out of treasuries and into the 'real' economy.

At tipping point will happen at some point and people will realize that the US Dollar, Euro and other currencies can and are being printed in unlimited amounts. Once a crisis occurs in a currency, it takes years (decades?) for a country to recover. The only question is when will we move from deflation to inflation? To that question, I have no answer. But with each QE program, the time comes closer.

Once we have a tipping point from deflation to inflation, gold prices will skyrocket. But when???

Monday, April 9, 2012

The Jobless Recovery

No matter how the government calculates the unemployment rate, the employment rate is still very very low for a recovery.
The simple fact is employment is not growing like it should in a recovery. Why?

1) Anytime you have a financial panic, the growth will be slower. This has been well documented by several studies and needs no further comment.
2) Specific actions by the Obama Administration has lead to lower employment. The health care act and government regulations in general have can lead to increased cost of employing people. Especially if the regulations deal with firing or cutting employment, firms will respond by decreasing the hiring of employees.
3) Technology has increased the productivity of employees which is a long term good for the economy, but a short term drag.
If this were true, then once economic growth increases above two percent, employment growth should pick up. If employees are very productive, it will make sense to hire them, so they increase profits. Anytime a person is more productive and the firm can increase it's sales, it will make sense to hire more people. Increases in productivity are GOOD for employment.

But as the chart below shows, employment increases just have not happened. Clearly something very basic is wrong.

Wednesday, April 4, 2012

Which Direction?

There are two possible extreme courses:

1) The economy grows and QE3 is not needed
2) The economy falters and QE3 is needed.

What the market seems to like is the second alternative, while I like the first alternative. What has happened every time QE3 is 'more off the table' is the market falls. But this is very shortsighted. Bernanke has made it very very very clear: The main reason for the Great Depression going longer than expected was a too quick increase in interest rates. The Fed WILL keep rates low for an extended period of time. Once economic growth returns in a reasonable rate, then and only then will the Fed take the foot off the pedal.

But the markets seem to react to every Fed meeting with uncertainty and confusion. The idea that the economy grows should be good news for the stock market. But instead, economic growth is being met with disbelief. The market is so pessimistic that the idea of sustained economic growth is discounted to the extreme. This negativity is seen through out American society today.

Even if the economy muddles through and provides low economic growth, the Fed will continue very aggressive expansionary actions. Only strong economic growth will force the Fed to act to reign in already occurring inflation.

Tuesday, March 6, 2012

Why the CS Report is only somewhat right and very wrong.

Credit Suisse has released a report entitled "Is the commodity supercycle behind us?" by Dong Tao. This report has a couple of important points, but misses several key items. But what does the report say?

The following is from the summary:
"We believe the golden age of infrastructure investment is behind
us now. The golden age of housing boom is behind us now. The
golden age of export is behind us now. The golden age of policy
stimulus is behind us now.
● But, one more leg of urbanisation is expected. Further
acceleration in policy housing is likely.
● Still, trend growth in the next decade is projected at 7–8% versus
10.3% in the past decade. Growth engines will shift from exports
and infrastructure to consumption, which means that it will take
less commodity consumption for each unit of GDP."

First, we need to see that commodities are not all identical. One key difference between commodities is 'capital commodities' vs 'consumption commodities'. Capital commodities are not used up and continue to exist for many years. For example, copper wire is produced and used for many years. It then can be melted down and re-used. It is a 'Capital commodity'. Other commodities like this are Gold, silver, aluminum, iron and to some extent steel. The use of the commodity continues for many years. In contrast 'consumption commodities' are consumed. Oil is consumed and cannot be 'resused' or used more than once. You go to the store in a car and gasoline is consumed and can not be 'resused' or used for many years. Likewise the soft commodities like soybeans are consumed.

In this article, the author makes no distinction between capital commodities and consumption commodities. Look at the following chart and notice the products along the bottom:

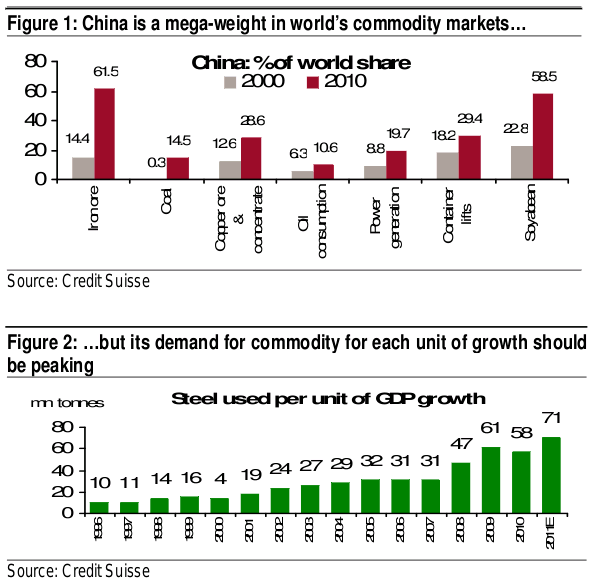
Do you see that copper is not the same as soybeans? If the statement about the 'age of infrastructure are true, copper demand might change. But why would soybean demand decrease because infrastructure investment decreases? The argument just does not hold. In fact, I would argue just the opposite. As the age of infrastructure is over, the age of consumption starts. In the age of consumption, consumption commodities will be in MORE demand than in the age of infrastructure. Soybeans and oil are will be in MORE demand than before.

Second, the law of growth is important. Let's use a simple example. If you start out at 100 on an measure of economic activity and that economic activity requires 10 units of 'commodities'. If you grow by 10%, that would increase your commodity demand by 1 (assuming the same ratio). Now assume the economy grows by 10% for 10 years. At the end of ten years, the index is at 235. Now assume the growth rate falls to 7%. The INCREASE in commodity demand, assuming a constant ratio is still 1.65 and is MORE than the INCREASE in demand for most years. The TOTAL demand for commodities is now 25.2, up from 10 in the first year. Do you see that the growth of the economy means that ZERO growth, does not decrease the 25.2 demand for commodities, but only decreases the 'growth rate of demand'. That is totally different than decreasing demand.

Thus, we have the Chinese economy about the change gears (if the CS author is correct about that), but that has vastly different implications for different commodities. As people achieve basic stability and economic prosperity, they start to have different demands. For example, the demand for jewelry and other high fashion will increase. Likewise the demand for more complex meals will increase. This will change the type of commodities that are demanded. Steel demand will decrease. But gasoline demand may skyrocket as people begin to buy cars and take vacations. Why work 80 hour weeks if you can't ever take a vacation? The demand for airtravel will increase and the demand for jet fuel will increase.

Thus a changing Chinese economy will have massive impacts on the price of commodities, but it will not all be bad. Some commodities will see skyrocketing demand, while others may see demand stay level.

Friday, March 2, 2012

Still Bearish on Nat Gas

The natural gas situation has changed somewhat. The production has started to fall, but the demand is still very very weak from the warm winter. We will have large amounts of natgas in storage and this will limit prices till next January. Only a crazy cold spell will decrease this overhang and now that the sun is higher in the sky, the demand for natgas falls every day all other things being constant. Thus, the price of natgas will be low all summer. At some point the price of natgas will rise, but any increase that is enough to get producer's attention, will increase rig counts. That will increase production and bring prices back down.

The only question is what are the prices that will clear the market this summer and what can the price rise to before rig counts start up again.

Tuesday, January 3, 2012

Bearish on Natural Gas

The ng market is over-supplied. Until demand increases, the market (ung) is not a good investment. Having said that, the cure for low prices is low prices. The demand for nat gas will continue to increase. For example, visiting my brother in Evansville Ind, I saw near a major road "Natural Gas Filling Station: Price $1.38 a gallon". When a natgas filling station is open and in a good location, maybe the tide is turning. While usage by vehicles is small and not growing near fast enough, it has the capacity to skyrocket.

But even more important, power generation usage will grow. This category will determine the price of natgas more than any other. In all previous posts, I have argued "weather, weather and weather" determined the price of natgas. No longer. While weather has the ability to temporary change the price of natgas, it no longer can deliver the large change in demand that is needed for prices to go back to $4 (much less $10!). Quite simply the basic demand for natgas from power generation has to increase for natgas to increase in price.
To see that the following chart shows the weather related demand for residential and commercial:

Notice the base (summer months) demand is relatively flat over the past 10 years. Likewise while the top tips are slightly higher, not by much. Quite simply residential and commercial demand can be seen as only slightly increasing.
So without major changes in how heating in residential and commercial buildings are generated, we will depend on industrial and power generation for increased demand.

Will this happen? For electric generation, it is happening:


Notice in the chart above, the baseload natgas demand has increased. This is very important, because one natgas power plant can consume alot of natural gas. It takes a ton of buildings to change heat sources to equal the demand from one natgas power plant. So one (the only?) source of increased demand is power plants.

What do we have on the regulatory front? We have the EPA just issuing new rules on emissions that make coal plants much more costly. They will shut down a significant number of coal plants and change the fuel to natgas. This transition is the only one that will quickly change the demand for natgas.

On the other side of the equation, we need to be careful not to expect too much from supply changes. The point being if the price were to rise from some temporary factors (a cold winter), the supply could increase very fast. The number of potential natgas wells is huge, if the price rises back to $5. Thus, until the baseline demand is significantly higher, natgas will not sustain a price above $4.

What about LNG? Here is the problem: the length of time it takes to permit, plan and build natgas export plants is years.... 5 years? We will not see ANY exports before 2014. Maybe 2016. Yes the possibility of significant demand for natgas from LNG exports exists, but we cannot build the plants before 2015. So between now and then power generation demand is the only source of increased demand that can really impact the price of natgas.

Conclusion: You can predict the natgas price by the size and number of natural gas power plants. Watch the trend and if the number of plants increases enough the demand for natgas may rise and increase price. Otherwise, any temporary increase in price will bring large amounts of supply to crush the price increase.